Developing the Dashboard App
Warning
You muse have followed Enabling App Development for any part of this tutorial to work.
Things To Know
We are going to be using bundler through a script which comes with OOD located in the root of the
dashboard at bin/setup. What this will do for us is essentially run bundler and npm to ensure
are environment is correct. This is all being pulled from the dashboard Gemfile. You could, in theory,
add whatever you like to this Gemfile and rebuild OOD with that new gem for development work, as an
example.
Also, it is recommended to set this to your local app environment so that bundler does not try and install
the gems on the system, as unlike npm which starts builds locally by default, bundler attempts
system installs by default.
Create a Dev Dashboard
clonethe OOD repo into:cd ~/ondemand/miscthengit clone git@github.com:OSC/ondemand.gitWork out of the
devdirectory/space:cd ~/ondemand/dev/.Symlink to the
dashboardapp in the cloned repo:ln -s ../misc/ondemand/apps/dashboard/dashboard/ dashboardMake a branch and to begin word on your dev dashboard:
git checkout -b dev_workRebuild the ood dashboard app:
bin/setup.Navigate to the Sandbox and launch your
dashboardapp to use thedev_work.
Notice the url for this /pun/dev/dashboard app. No longer do
you see /pun/sys/dashboard/ but instead /pun/dev/dashboard/.
Add .env.local File
Now that we have a our dev dashboard running, a good first step is to next ensure it
looks different from the production dashboard. This will help ensure not ending up in the wrong tab,
using sys/dashboard instead of dev/dashboard, and possibly causing confusion.
Use an editor or IDE and do the following:
cd ~/ondemand/dev/dashboard
touch .env.local
vim .env.local
The idea here is to make sure the dev dashboard looks different so we don’t have to check that url in the
browser to know which dashboard we are in.
Inside the .env.local we can add an environment variable to change the color of the dev dashboard like so:
# .env.local file
OOD_BRAND_BG_COLOR='grey'
Now click the Develop dropdown menu on the upper right corner and click Restart Web Server. After a few moments
you should now see the dashboard with a grey background in the banner. This will help to distinguish your dev
environment from the production.
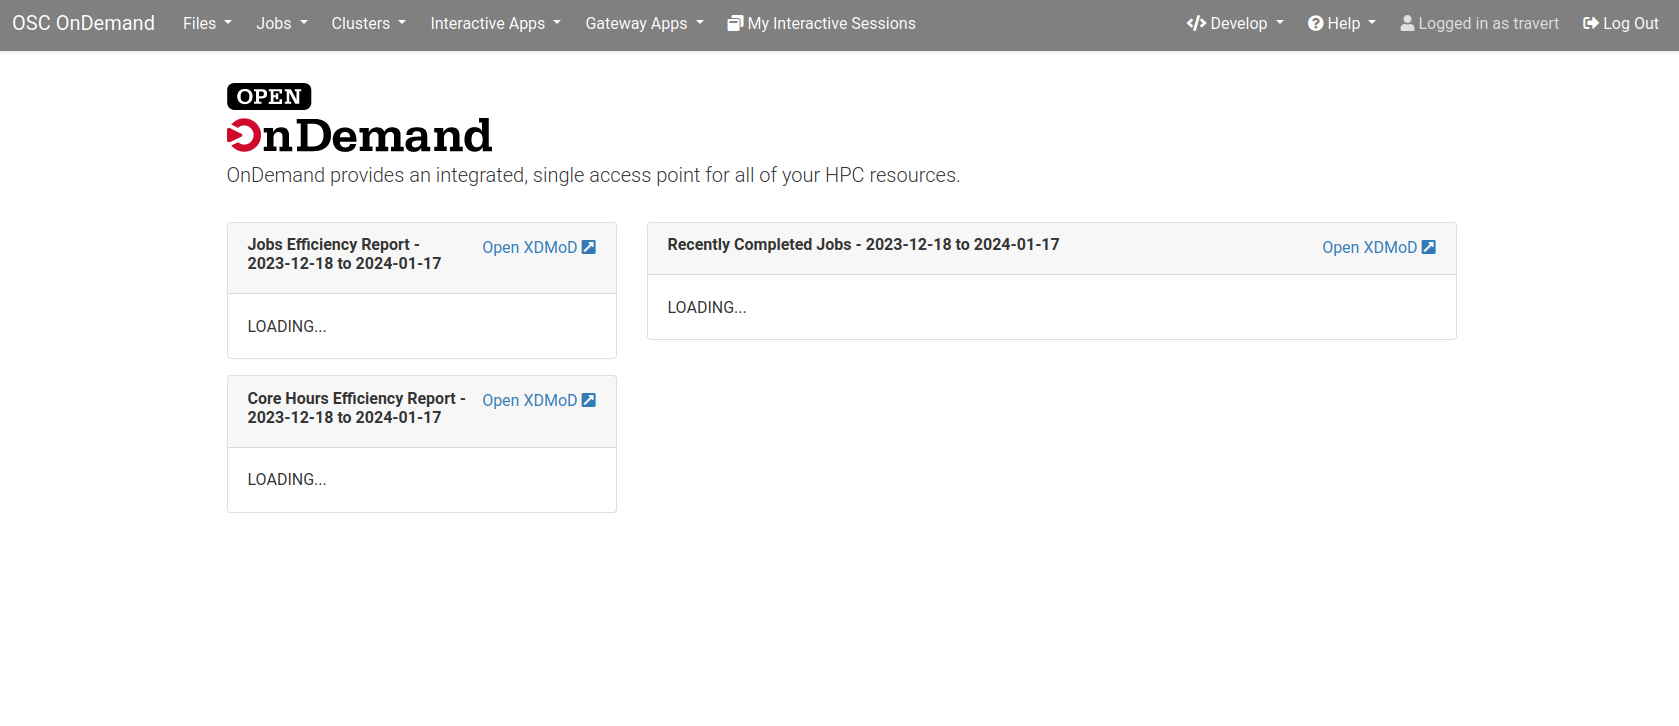
Fig. 10 Different banner color for the dev dashboard
Set Dev Configuration Directory
Our dev dashboard is still using the same configuration files as the system dashboard, but we can change this.
Go back into .env.local and set a new path for the dev dashboard to pick up its own
configurations using the OOD_CONFIG_D_DIRECTORY environment variable like so:
# .env.local file
OOD_CONFIG_D_DIRECTORY="~/ondemand/dev/dashboard/config/ondemand.d/"
We need to restart the PUN when we add or change environment variables with bin/setup.
Add Dev Configurations
Now, we can begin to set our own configurations in our new ondemand.d directory for
the dev dashboard and see the changes. Let’s add some configs to our dev dashboard to get
an idea what can be done and play with the layout.
We will add pinned_apps to our dev dashboard as an example to see how this works.
Create a file in the ~/ondemand/dev/dashboard/config/ondemand.d/ directory named ondemand.yml then
open the file and add the following:
pinned_apps:
  - sys/*
pinned_apps_menu_length: 4
pinned_apps_group_by: category
Assuming youre restarted the PUN when you set the new config directory above, you should be able to simply refresh the browser and see the new pinned apps layout take effect. If not though, simply restart the PUN as usual to force the changes.
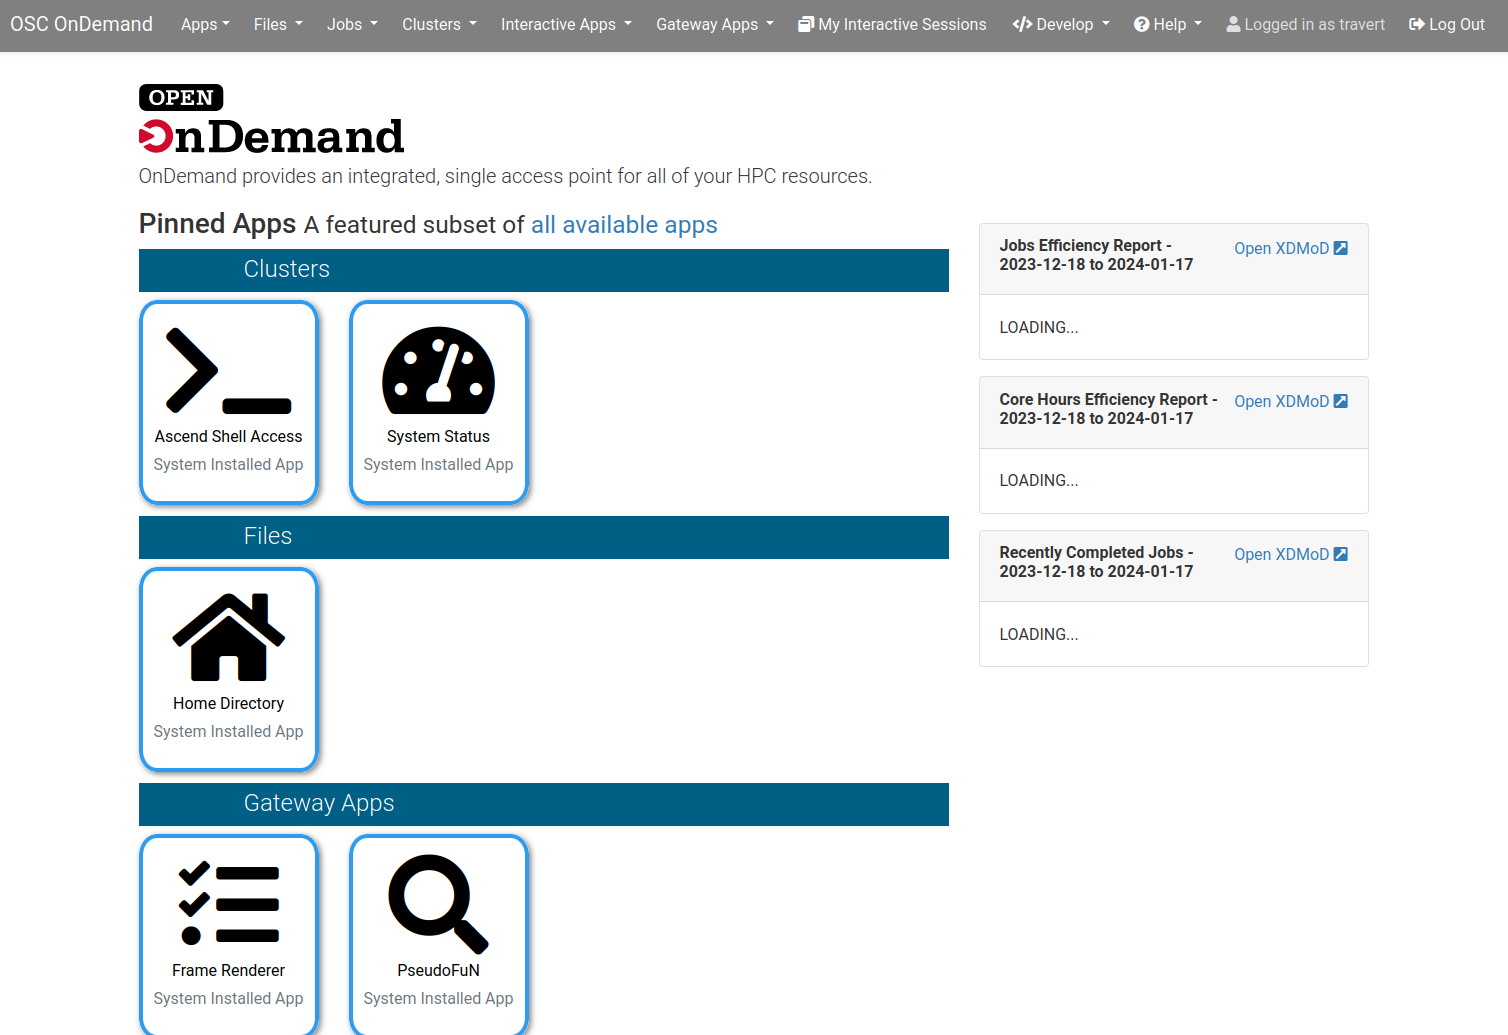
Fig. 11 Dev dashboard with its own pinned apps configuration
Now, we can begin to add other configurations to this new ondemand.yml and keep restarting
the PUN to see our changes.
This is a great way to test out new features, or play with any features you may be interested in with OOD before making the changes in production or spinning up a whole dev environment with a VM.
At this point you have all the pieces needed to use the Customizations page and play with those changes in your dev dashboard.
But, what if we want to add something to Open OnDemand?
Develop OOD in OOD
With all the above in place, you can also begin to add features and functionality to OOD in this development setting to then see how this will actually run and work.
Suppose you see a feature being worked on in the OOD repo on the branch new_feature. How could you pull
this work down and see its current state while also trying to build it out?
First, launch the shell and go into your dev dashboard root then:
git pullgit checkout new_featurebin/setup
After the build you now have the feature ready to be worked right there in your dev dashboard.
Go ahead and enter you Sandbox and launch the dev dashboard. What you are in once that is done is the current state the feature is in.
If you are not making any changes to the configurations, as the steps above mostly do, then each change to the code simply requires page refreshes to see the feature work.