Creating a Science Gateway App
Overview of App
We will make a science gateway that displays information retrieved, processed, and rendered in the browser using phusion passenger and the python programming language.
The app we will be copying is: https://github.com/OSC/ood-example-science-gateway. Running this app at the start you should only see:
Fig. 10 Initial state of app after launch.
And by the end of this tutorial the app will look like the following:
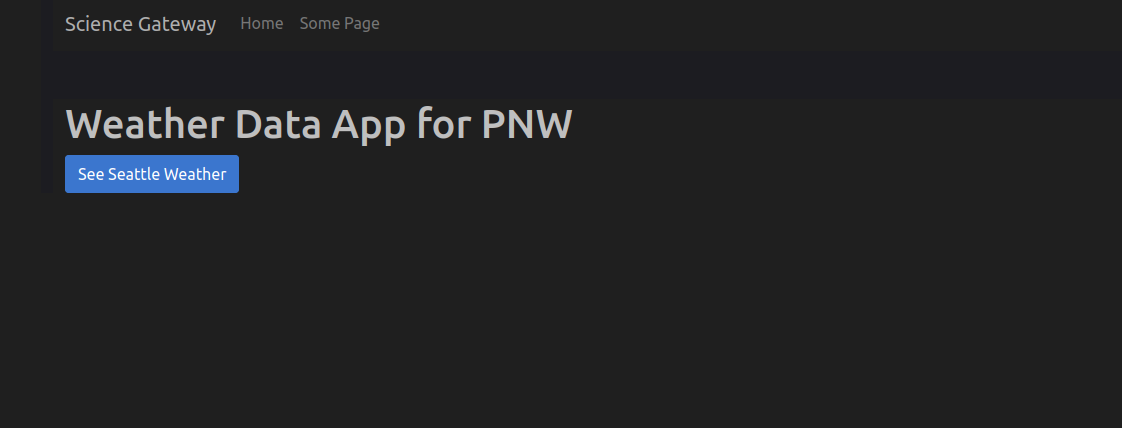
Fig. 11 Final state of app’s index after tutorial.
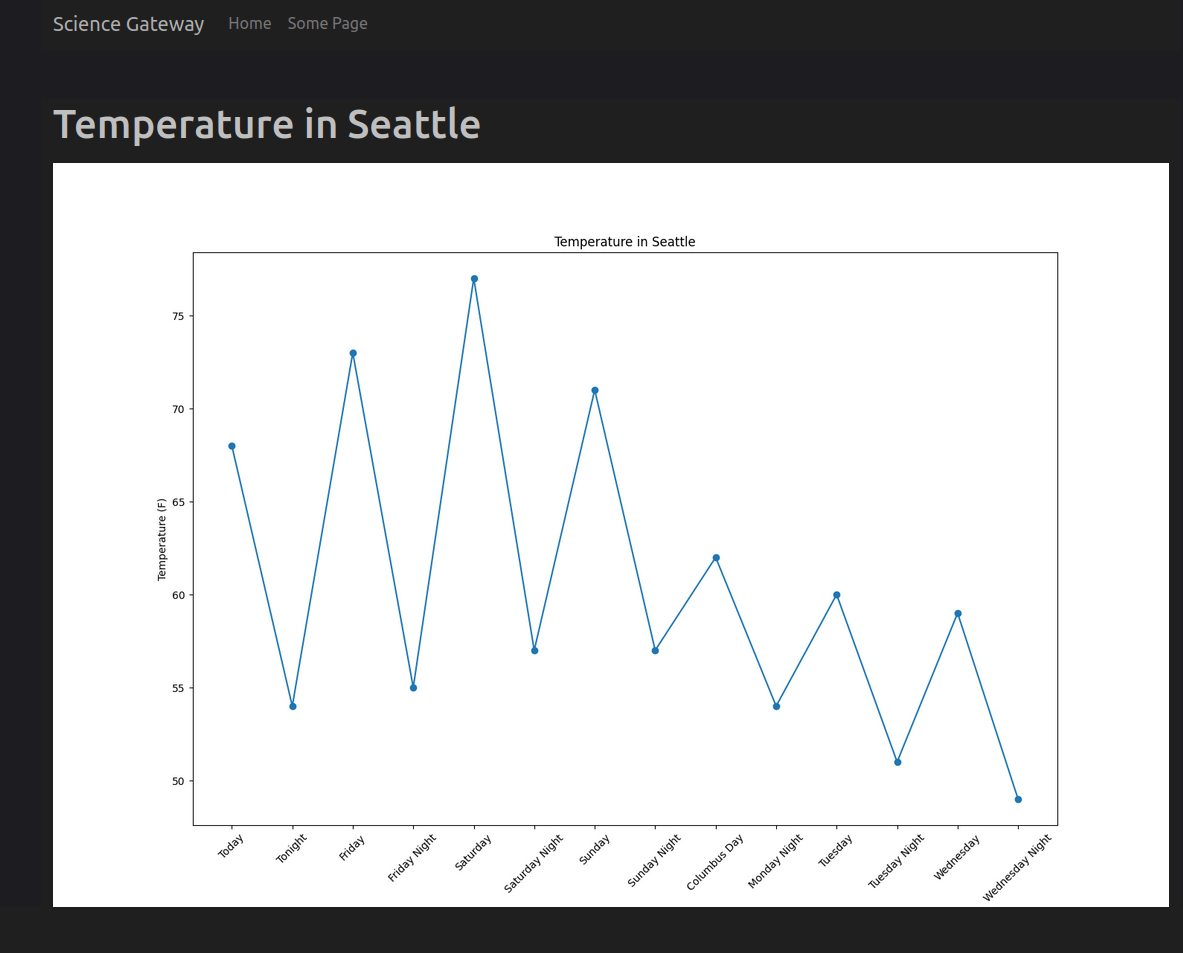
Fig. 12 Rendered graph with retrieved data from NWS and graphed with matplotlib.
This assumes you have followed the directions to Enabling App Development in the Dashboard.
Our app will use and have the following:
Bootstrap 5 for nice views.
The navbar in the app will contain a link back to the ood dashboard.
The app will make requests for us which are then processed and returned for our view.
It is built using Python’s Flask which is similar to the Sinatra framework, or Node.js’s Express .
Benefits
This will provide users with an example of how to build their own science gateway in OnDemand and hosted through OnDemand.
By doing so, we will se that OnDemand provides great flexibility in
allowing you to work in either ruby, node.js, or
python which all integrate easily with Passenger Phusion.
But any language can now be supported as of Passenger Phusion 6, as long as your app:
Speaks
http.Binds to a
port.Runs in the foreground.
And The language of your choice and its build tools are available on your system.
The App’s Packages and Code
For any app we develop, the key thing here will be that we can use our own packages and code to build what we are trying to do, assuming your cluster has the language and tooling in place.
We will be using python3 in this example with a combination of venv and pip to build our project.
This will enable us to login to OnDemand and then work within our development sandbox to use
code from our own python modules. This could just as easily be our own gems if we used
ruby or packages if we used node.
This means we will have to do some setup to ensure our app uses our own designated packages and not OnDemand’s or the system packages. This gives users a great deal of flexibility in how they develop.
Phusion Passenger Project Structure
The project structure is simply following a common pattern used when developing a phusion passenger app.
This mainly consists of an entrypoint file for passenger phusion, and then various files to be used by our webserver to be served or executed by the app.
You can see this explanation and the various forms of the files and their names in the Passenger project structure documentation
Files and Their Purpose
File |
Description |
|---|---|
|
Entry point of the Phusion Passenger app which expects the file to be named |
|
Flask app config and routes. |
|
the main section of the html page template using |
|
the rendered HTML from |
|
A Phusion Passenger convention to restart our server each request to see our code changes. The file should be empty. |
Build From GitHub
There are going to be 2 branches for this repo. The completed branch has all the code we are going to write and the
completed app.
The initial_state branch is what will have the initial project skeleton files we need to begin in order to follow the steps below.
To follow along with the remainder of the tutorial run the following commands from your dev directory:
git clone git@github.com:OSC/ood-example-sciGatewayApp.git
cd sciAppGateway
git checkout initial_state
Development
Warning
Ensure you have activated your venv enviornment before issuing any pip commands.
If you are returning just cd to your app’s root and issue source .venv/bin/activate.
Install Software
Let’s first install the packages and libraries we need to make some web requests and graph the returned
data. Python provides a great package for this called requests which we can use with flask, and
we want to graph output from our requests so let’s grab matplotlib too.
If you already built from git above, please skip the first few steps:
# from the cli
git clone git@github.com:OSC/ood-example-sciGatewayApp.git
cd sciGatewayApp
git checkout initial_state
python3 -m venv .venv        # for first setup only
source .venv/bin/activate    # always when starting work back up
pip install flask requests matplotlib
At any time of development, if another package is needed, we are always free
to come back and do a pip install <package>. Ensure the venv environment is
active when you do.
Initialize Routes
Now go into app.py and use these packages like so:
from flask import Flask, render_template, send_file, url_for

MyApp = Flask(__name__)

@MyApp.route("/")
def hello():
    return render_template('index.html')

if __name__ == "__main__":
    MyApp.run()
Initialize Our Main Code
We will be writing some code here to run a service, so if it isn’t there already,
create a directory from the root of the app called services to hold our code.
Now go into the services/weather_service.py file and add the following:
import requests
import matplotlib.pyplot as plt
import io

def fetch_weather_data(lat, lon):
    headers = {'User-Agent': 'MyWeatherApp'}
    url = f"https://api.weather.gov/points/{lat},{lon}"
    response = requests.get(url, headers=headers)

    if response.status_code == 200:
        point_data = response.json()
        forecast_url = point_data['properties']['forecast']
        forecast_response = requests.get(forecast_url, headers=headers)

        if forecast_response.status_code == 200:
        return forecast_response.json()
        else: return 'Forecast response failed'

    return None

def generate_temperature_plot(weather_data):
    time_periods = [period['name'] for period in weather_data['properties']['periods']]
    temperatures = [period['temperature'] for period in weather_data['properties']['periods']]

    plt.figure(figsize=(15, 10))

    plt.plot(time_periods, temperatures, marker='o')
    plt.xlabel('Period')
    plt.ylabel('Temperature (F)')
    plt.title('Temperature in Seattle')
    plt.xticks(rotation=45)

    file_path = "static/temperature_plot.png"
    plt.savefig(file_path)
    plt.close

    return file_path
This is going to be the core of our service to start. We first reach out to the National Weather Service’s API and grab some location data by the longitude and lattitude, here we use Seattle as an example.
Then when the response comes back, we are going to grab a bit of data from that payload to use with matplotlib
to graph some data and land it in a static folder for us.
We will plan to use the static folder going forward for any data like this we wish to generate and serve.
Add Initial Views in template/
Warning
Because of technical reasons with our version of Sphinx, the below url_for calls will be missing a single
‘{‘ in order to get around Sphinx rendering issues. Make sure to add the extra ‘{‘ before each call to ‘’url_for’’
in your own code.
The templates directory will hold the files we intend to use for our html files. First let’s edit the
index.html to look like the following:
<!DOCTYPE html>
<html lang="en">
<head>
    <meta charset="UTF-8">
    <title>Weather App</title>
    <link href="https://cdn.jsdelivr.net/npm/bootstrap@5.1.1/dist/css/bootstrap.min.css" rel="stylesheet">
</head>
<body>
    <div class="container mt-5">
        <h1>Weather Data App for PNW</h1>
        <a href="{ url_for('seattle_weather') }" class="btn btn-primary">See Seattle Weather</a>
    </div>
</body>
</html>
And then we will add a seattle_weather.html file with the following:
<!DOCTYPE html>
<html lang="en">
<head>
    <meta charset="UTF-8">
    <title>Seattle Weather</title>
    <link href="https://cdn.jsdelivr.net/npm/bootstrap@5.1.1/dist/css/bootstrap.min.css" rel="stylesheet">
</head>
<body>
    <div class="container mt-5">
        <h1>Temperature in Seattle</h1>
        <div class="mb-3">
            <a href="{ url_for('index') }" class="btn btn-primary">Back to Home</a>
        </div>
        <div class="mt-3">
            <img src="{ url_for('static', filename='temperature_plot.png') }}" alt="Temperature Plot" class="img-fluid">
        </div>
    </div>
</body>
</html>
Add More Routes
So, now we have two pages, but we need to go back into our app.py to build the route for our
seattle_weather page:
@MyApp.route("/seattle_weather")
def seattle_weather():
    lat, lon = 47.6062, -122.3321
    weather_data = weather_service.fetch_weather_data(lat, lon)

    if weather_data:
        img_path = weather_service.generate_temperature_plot(weather_data)
        return render_template('seattle_weather.html', img_url=img_path)
    else:
        return 'Failed to get weather data', 400cs
Now we have added the route and variables needed to make the pages and their API calls work.
The index should now appear as:
And the weather graph should appear as something like the following:
Brand App
The app is looking good, but the details page still shows the app title “Science Gateway”.
To change this and the icon, edit the manifest.yml:
name: Sci Gateway App
icon: fas://torii-gate
description: |
This is a demo app that uses python flask, the national weather service api, and matplotlib
to create a simple science gateway.
icon: fas://torii-gate
The icon follows format of
fas://{FONTAWESOMENAME}where you replace{FONTAWESOMENAME}with an icon from https://fontawesome.com/icons/. In this case we are usingtorii-gatewhich we write in the manifest asfas://torii-gate. You can see details on this icon at https://fontawesome.com/icons/hdd?style=regular
Publish App
Publishing an app requires three steps:
Remove
tmp/always_restart.txtsince we are done developing.Updating the
manifest.ymlto specify the category and optionally subcategory, which indicates where in the dashboard menu the app appears.Having an administrator checkout a copy of the production version to a directory under
/var/www/ood/apps/sys.
Steps:
Add a category and subcategory to the
manifest.ymlso the app appears in the Interactive Apps menu:... category: Interacitive Apps subcategory: Science Gateways
Version these changes. Click Shell button on app details view, and then
committhe changes:git add . git commit -m "update manifest for production" # if there is an external remote associated with this, push to that git push origin <your working branch>
If using a remote, go in and merge your request to the
mainormasterbranch.As the admin,
sudo copyorgit clonethis repo to production# as sudo on OnDemand host: cd /var/www/ood/apps/sys git clone git@github.com:OSC/ood-example-sciGatewayApp.git
Reload the dashboard.
Fig. 13 Every user can now launch the Science Gateway from the Interactive Apps menu.
Warning
Accessing this new app for the first time will cause your NGINX server to restart, killing all websocket connections, which means resetting your active web-based OnDemand Shell sessions.